There are days that I really miss That’s Incredible.
Remember the early ‘80s TV show that had the most unbelievable stunts and stories – like that guy who could catch bullets in his mouth. For a chatty ten-year-old in the pre-Internet world, that show was mindblowing.
One of my favourite segments was about this guy who could pick up an old school record album and tell you what song was on it – just by looking at the grooves. I’d still consider it a really, really cool feat – if it wasn’t for the fact that you can do pretty much the same thing with a histogram.
We talked about histogram’s in this week’s post. They’re the line graphs that describe you where all the dark (left side) and light (right side) parts of a photo. Most times, you use histograms to tell you if your photo is underexposed or overexposed. But here’s the cool part about histograms. You can pick out individual parts that are bright and dark, but by looking at the histogram. And if you can see it on the histogram, you can decide whether the photo is just right or needs some fixing.
Here’s an easy example.
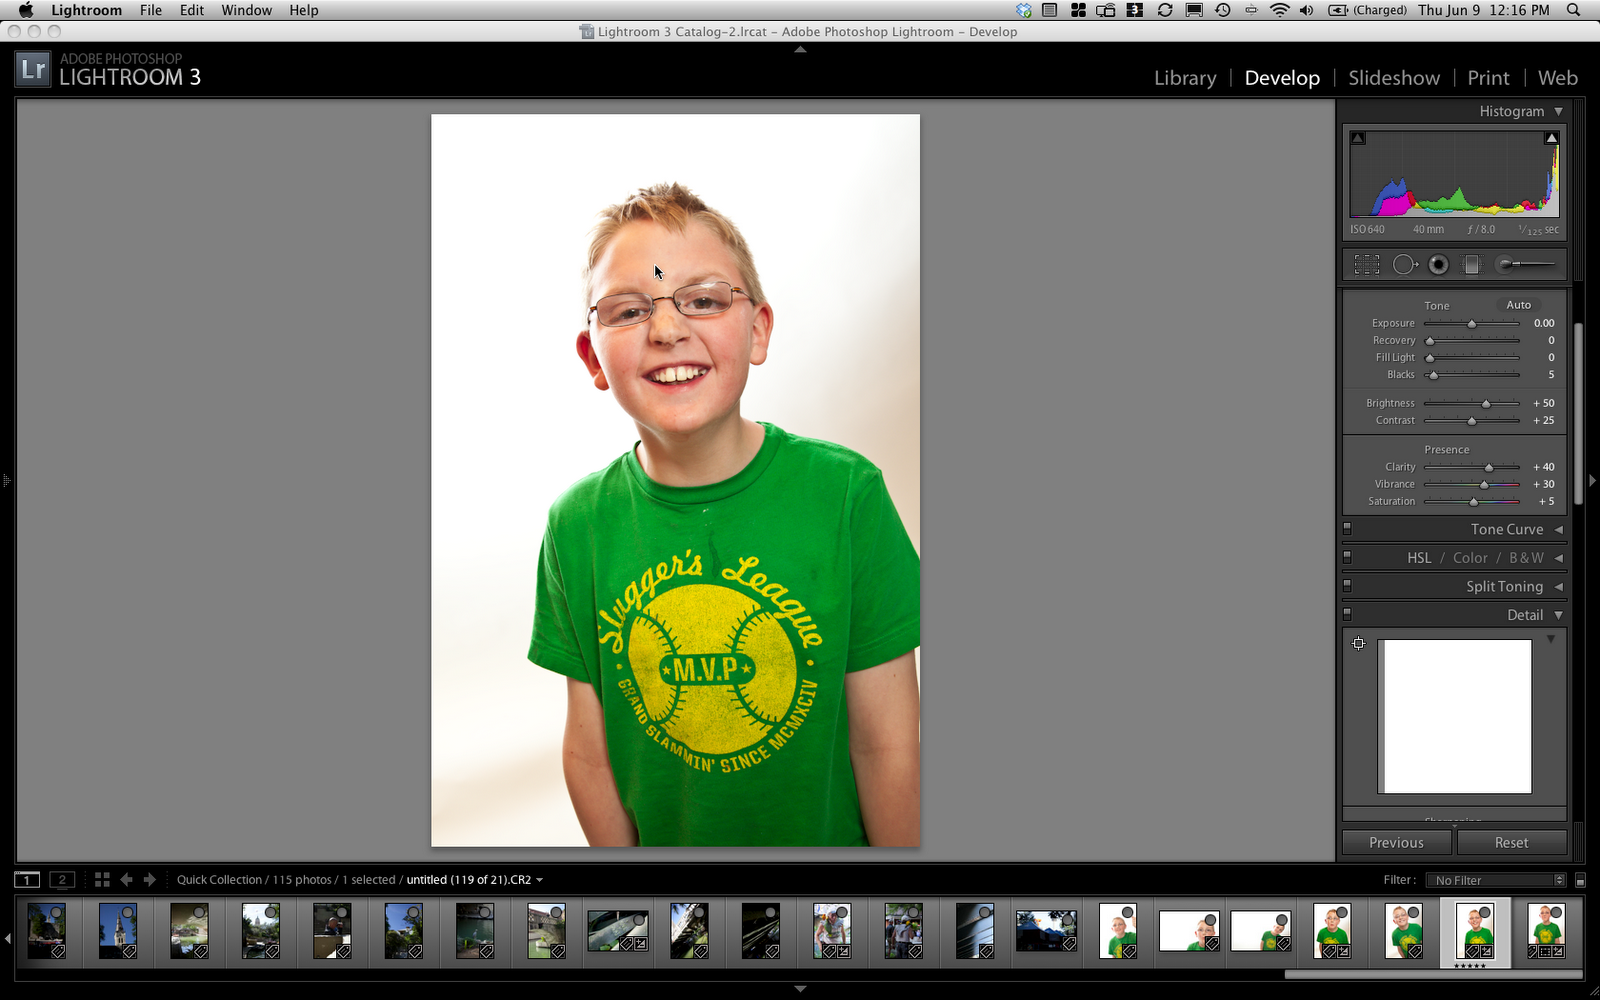
That’s an uncorrected photo I took of my son a few weeks ago. He looks pretty decent (minus the stains on the shirt and chocolate on the face), but the histogram is telling me something is really, really bright. If I look at the photo, I know exactly what that is – it’s the white background. But that’s the look I was going for. The boy looks fine – his shirt and face (except for the right side, but that’s on purpose) are smack dab in the middle of the histogram. How do I know? When I play around with the sliders to make the shirt brighter or darker, I can see the histogram change.
All you have to do is play around with the sliders and you too can figure out the histogram in no time flat. Now, that’s incredible.
No comments:
Post a Comment